AnalysisJuly 30, 2026

Seattle Construction Trends at Mid Year

Seattle development activity read from our live pages at mid year, with a plain note on the counting change that makes our earlier neighborhood numbers non comparable.

This is the mid year picture of Seattle development, read from our live pages on July 30, 2026. Our March trends post stays up unedited as the record of what we published then, and you can read it here, Seattle construction trends in 2026.

One thing has to come before the numbers. In July we changed how BuildVue counts the projects in a neighborhood, so the March figures and today's figures are not two readings of the same measure.

How we count neighborhoods now

Until early July, a neighborhood page counted every project that fell inside a rectangle drawn around the neighborhood on the map. Those rectangles overlap and reach past the edges of the areas they stand for. A single project could land in two neighborhoods at once, and a page could count buildings that nobody in that neighborhood would call theirs. The old method counted too many.

Neighborhood pages now count the neighborhood recorded on each project instead of anything drawn on a map. Those are the accurate numbers, and they are what every neighborhood figure in this post uses.

Two things follow. Today's counts come in lower than March's for most areas, and that is the counting change rather than anything that happened on the ground, so the two sets should not be subtracted from each other. And the neighborhood list on the Seattle hub page still runs on the old rectangle method, which is why its counts read higher than the neighborhood pages do. Where the two disagree, the neighborhood page is the one to trust.

The citywide totals moved for a related reason. We spent part of July on data quality work in the project records themselves, which changed which projects are tracked and how they are attributed. The March and the July citywide figures are each an accurate record of what the page showed on that date. Neither the size of the gap between them nor its direction measures the market.

Citywide at mid year

The Seattle page shows 723 total projects, 49,060 residential units, and $15.4B in estimated construction value.

For the historical record, in March we reported more than 680 tracked multi family and mixed use projects, more than 540 of them active, nearly 63,000 residential units, and more than $18 billion in construction value. That is the March record, on the basis we used in March.

The unit figure is a floor rather than a total. Many tracked projects carry no unit count in the permit record and add nothing to the sum, so the real number of homes in the pipeline is higher than 49,060. The value figure is a rough scale. It mixes early design estimates, which are often placeholders, with the real values on issued construction permits.

We do not publish a year over year filing comparison and this post does not start one. Our import pipeline was down from late March to late June 2026. Counting filings by month across that stretch would measure our own outage instead of the market, so a claim that filings rose or fell this spring would be wrong either way.

The citywide page shows a total without an active split, so the active counts below come from the neighborhood pages.

What is actually being built

The word construction in a permit system covers more ground than a fenced site with equipment on it. A project can hold a construction status while its building permit sits in review for months. The honest line is the issued construction permit, the document a project needs before work starts.

The Downtown page shows 23 of its 41 tracked projects under construction. That label follows the permit status, so some of those 23 are waiting on a permit rather than building.

Our largest active construction projects post from July 6 read the permits directly and found about 130 Seattle projects with an issued building permit and work underway. That figure is from July 6 and we have not re-derived it for today, so read it as the recent scale rather than a live count. To check one project, look for the issue date on its construction permit.

Neighborhood counts at mid year

Every row is read from that neighborhood's own page on July 30, 2026, under the current counting method. The last column shows what the March post published under the old rectangle method, included as the historical record only. The two are not comparable.

NEWSLETTER

Get a monthly newsletter with new features plus Seattle Metro construction activity. No spam.

NeighborhoodProjectsActiveHomes trackedEst. valueMarch post, old method
Downtown41267,388$3.9B74
University District46343,038$923M36
First Hill40323,036$1.1B50
Northgate34242,657$585M38
International District33233,472$709M52
Fremont29202,191$446M37
South Lake Union27223,985$2.3B43

Downtown carries the most homes and the most money of the seven, with 7,388 residential units tracked and $3.9B in estimated value. Its average height of 22.6 stories sits far above the rest of the group, and its highest value site is 1600 9th Ave at $700M, an early design figure rather than a permit value.

The University District has the largest set of active projects, 34 of its 46. Its active set runs 23 residential only buildings to 9 mixed use ones, and the detail sits in what is being built in the University District.

South Lake Union has the smallest project count in the table and the second largest value at $2.3B, at an average of 14.3 stories. Its largest project by both homes and value is 1101 Thomas Street.

First Hill runs on volume rather than height, with 32 active projects at an average of 7.6 stories and 747 Broadway its highest value site at $210M. The International District tracks more homes on fewer projects, 3,472 across 33, and its tallest, largest, and most valuable site is one building, 821 S Washington St, at 21 stories and 552 homes for $125M.

Northgate and Fremont are the low rise rows, averaging 4.5 and 5.2 stories. Northgate's largest is 12301 Stone Ave N at 540 homes and about $210M. Fremont's is 3833 Stone Way N at 231 homes, and for the street level detail behind that row, read what is being built in Fremont.

Track it yourself

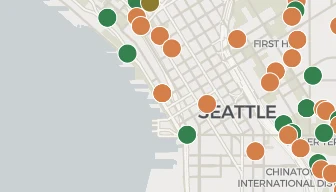
Every figure above sits on a page you can open. Citywide totals are on the Seattle hub, each neighborhood page carries the active split and the type breakdown, and you can sort or filter the whole set on the map.

Frequently asked questions

Why are the neighborhood numbers lower than the March post?

Because the counting changed. Until early July a neighborhood page counted the projects inside a rectangle drawn on the map, and those rectangles overlapped and reached past neighborhood edges, so counts came in too high. Pages now use the neighborhood recorded on each project. The current numbers are the accurate ones and the March numbers are the March record.

Why do the neighborhood counts on the Seattle page differ from the neighborhood pages?

The list on the citywide page still runs on the older rectangle method, so its per neighborhood counts read high. Each neighborhood's own page uses the neighborhood recorded on the project, and that is the number to use.

How many Seattle projects are under construction right now?

Our July 6 review of issued building permits found about 130 projects with a permit in hand and work underway. Counts that use the raw construction status run much higher, because a project keeps that status while its building permit is still in review.

Which Seattle neighborhood has the most activity at mid year?

Among the seven in the table, the University District has the most active projects with 34. Downtown leads on homes and on construction value, with 7,388 residential units tracked and $3.9B.

Does BuildVue publish year over year construction trends?

Not for filing volume. Our import pipeline was down from late March to late June 2026, so month over month and year over year filing counts across that period would reflect the outage rather than real activity. We publish current state and completed month recaps instead.

WHY BUILDVUE

See the projects behind this article

BuildVue tracks development permits across two dozen cities around Puget Sound. Every project in this article is on the live map with its full permit history.

What the paid plans include
  • Full project details. Contacts, sales history, the building program, and the full permit record.
  • Alerts. Daily email alerts for followed projects and saved searches.
  • Portfolios. Every past and current project from each developer and architect.
  • Trends. Market statistics and neighborhood totals.
  • Exports. Any filtered list as a spreadsheet.
  • Assistant. Answers about the data in plain words.

Plans start at $29 a month. Every account begins with a free 14 day trial of Pro. No card needed.

Tags

trendsseattledataanalysispipelineneighborhoods

Related